Ask What Is Connected, Not What Is Nearby

Property analytics has run for decades on the 500-metre circle. A peer-reviewed Python library replaces the circle with the street network, and changes what the analysis can honestly say.
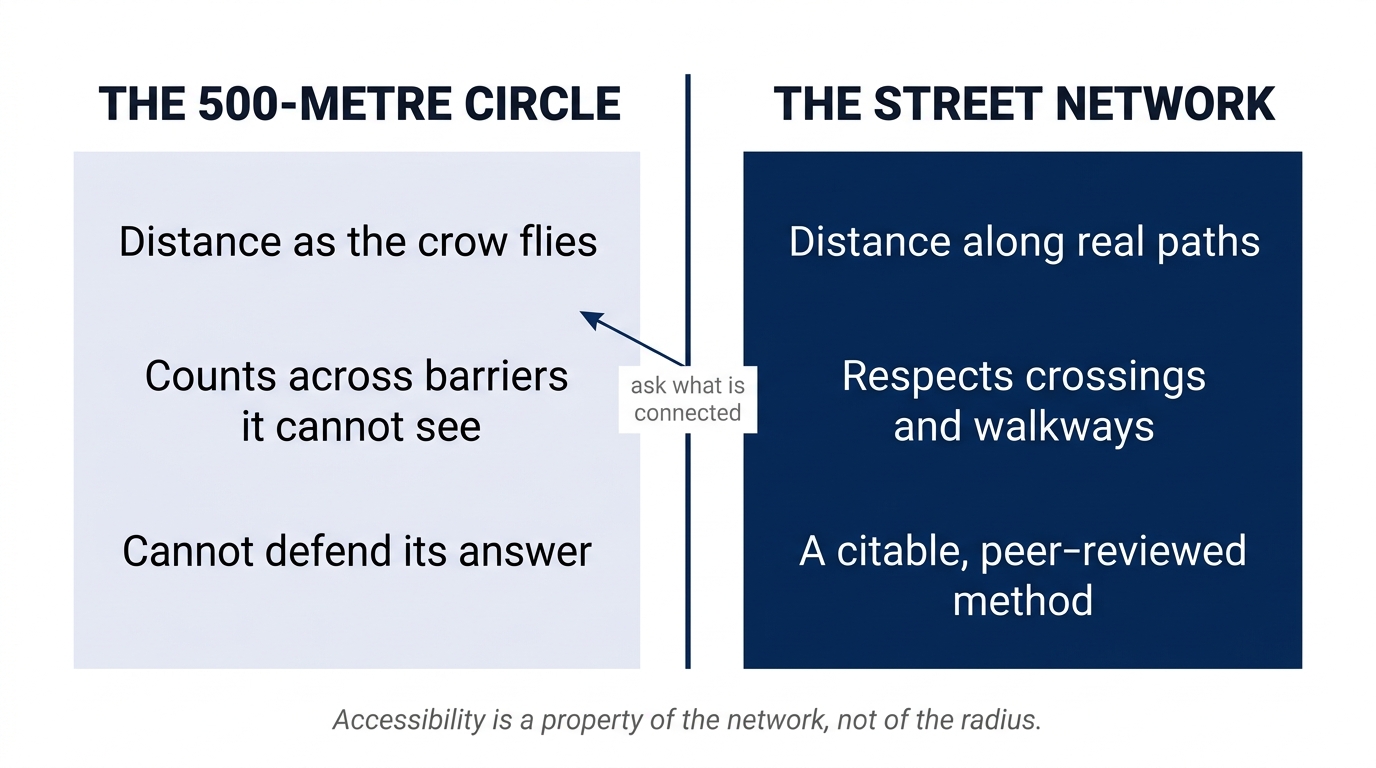
Almost every location analysis in property work reduces to one move: draw a radius and count what falls inside. Amenities within 500 metres, transit within a kilometre, comparables within two. The circle is easy to compute and quietly wrong, because people do not travel as the crow flies. A school 400 metres away across a six-lane highway with no crossing is not an amenity. A clinic 700 metres away along a covered walkway is.
A library out of a geographic data science lab, city2graph, published alongside a peer-reviewed journal paper, makes the better question computable at scale. It converts geospatial data, building footprints, street segments, public transport feeds, origin-destination flows, into graphs: networks of things connected by real paths, with distances measured along the network rather than across it. Instead of asking what is within 500 metres, you ask what is connected to this lot, by what, and how far along the connection. The answer is an object you can measure, cluster, or feed to a model.
Three Design Calls Worth Noticing
The library reads open building and street data as a first-class source, so anyone already maintaining a refresh of open map data can run it as one more batch job over an existing supply chain rather than standing up a new data programme. It preserves geometry through every conversion, so an analytical result lands back on the exact parcel it came from, ready to map, with no join for someone to maintain. And its machine learning half is optional: the graph construction and network analysis run on ordinary tooling, no GPU, so you can adopt half the library this month and defer the model question until you have a proven need. Anyone treating this as an all-or-nothing ML decision has misread the package.
The peer review matters commercially, not just academically. An analysis method that appears in a journal can be cited in a valuation report or a client deliverable as a method, not a vendor claim. In regulated professional work that difference decides what you are allowed to rely on.
Accessibility is a property of the network, not of the radius. Tools that respect the network can defend their answer; the circle never could.
The Honest Constraint
A graph is only as good as the layer it is built on, and open building data is uneven in this region: excellent in some districts, sparse in others. The strongest graphs available to any Malaysian practice are built not from global open data but from locally delivered footprint datasets, where they exist. That inverts the usual buy-versus-build instinct. The scarce asset here is not the analytics library, which is free and open. It is the verified local data underneath it, and whoever holds that layer decides how good the answers can be.
Part of the Regulated-Industry Product Management series from KG Consultancy.
Strategy and technology are the same decision. Over 15 years in fintech (CTOS, D&B), prop-tech (PropertyGuru DataSense), and digital startups, I have built frameworks that help founders and executives make both moves at once. Based in Kuala Lumpur.
Working on a 0→1 product?
I help founders and operators go from idea to validated product. Let's talk about yours.
Get in touch →