Your Company Is a Graph of Algorithms (and AI Is About to See It)

I have been describing companies the same way to bank COOs for the better part of two years. Not as org charts. Not as product portfolios. As graphs of algorithms.
What started as a way to explain AI strategy to a sceptical client has become the first slide of every serious engagement I run. The shift in framing matters because it changes what gets optimised, what gets automated, and what gets left alone.
This is a short walkthrough of the model, a worked example from a Malaysian loan-origination flow, and the regulated-industry caveat I see operators get wrong most often.
Why Your Org Chart Was Always Wrong
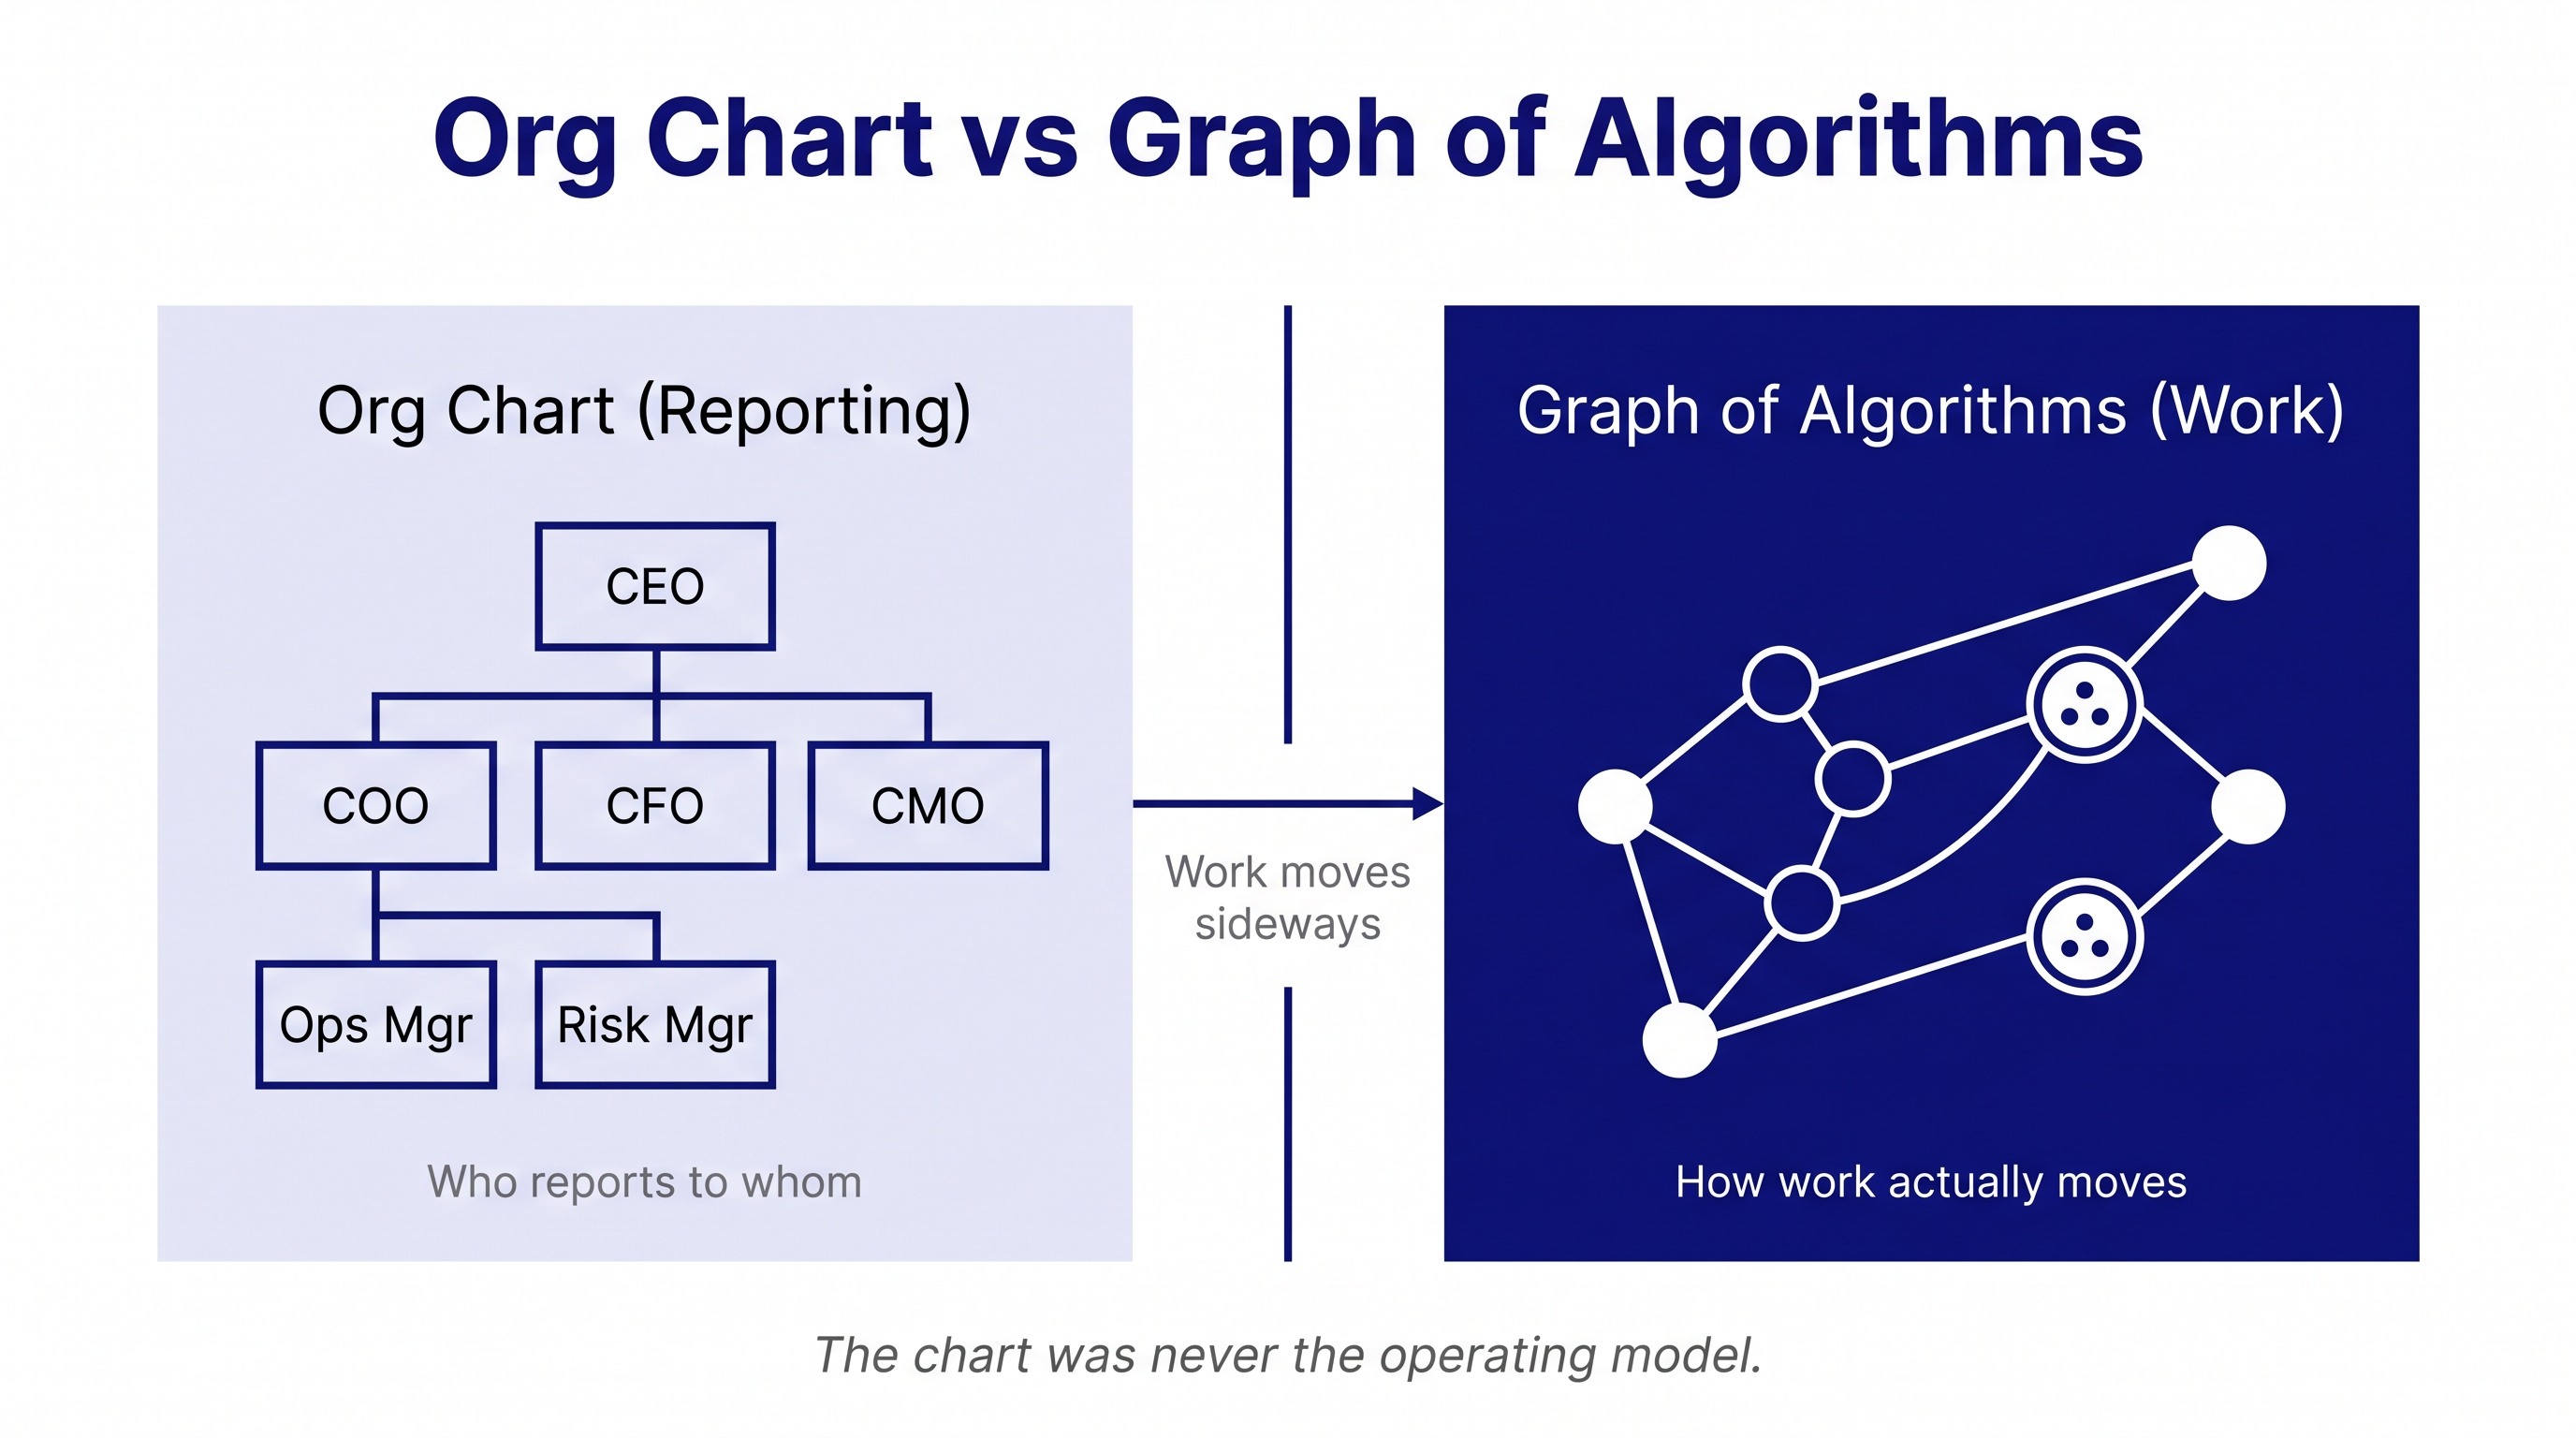
The org chart is an artifact for HR and legal. It tells you who reports to whom and which director signs which contract. It does not tell you how work actually moves through the company.
Work moves sideways, not downward. A loan application crosses six departments before it gets approved. A new product launch touches engineering, compliance, marketing, ops, customer support, finance. The chart that shows reporting lines has nothing useful to say about either flow.
For most of business history, this gap did not matter. The org chart was good enough for boards and head-count budgets. The actual work was understood by the people doing it, and the gaps were small enough to bridge with meetings and email.
That changes when the question becomes which work an AI agent can do. An org chart cannot answer that question. A graph of work can.
What "Graph of Algorithms" Actually Means
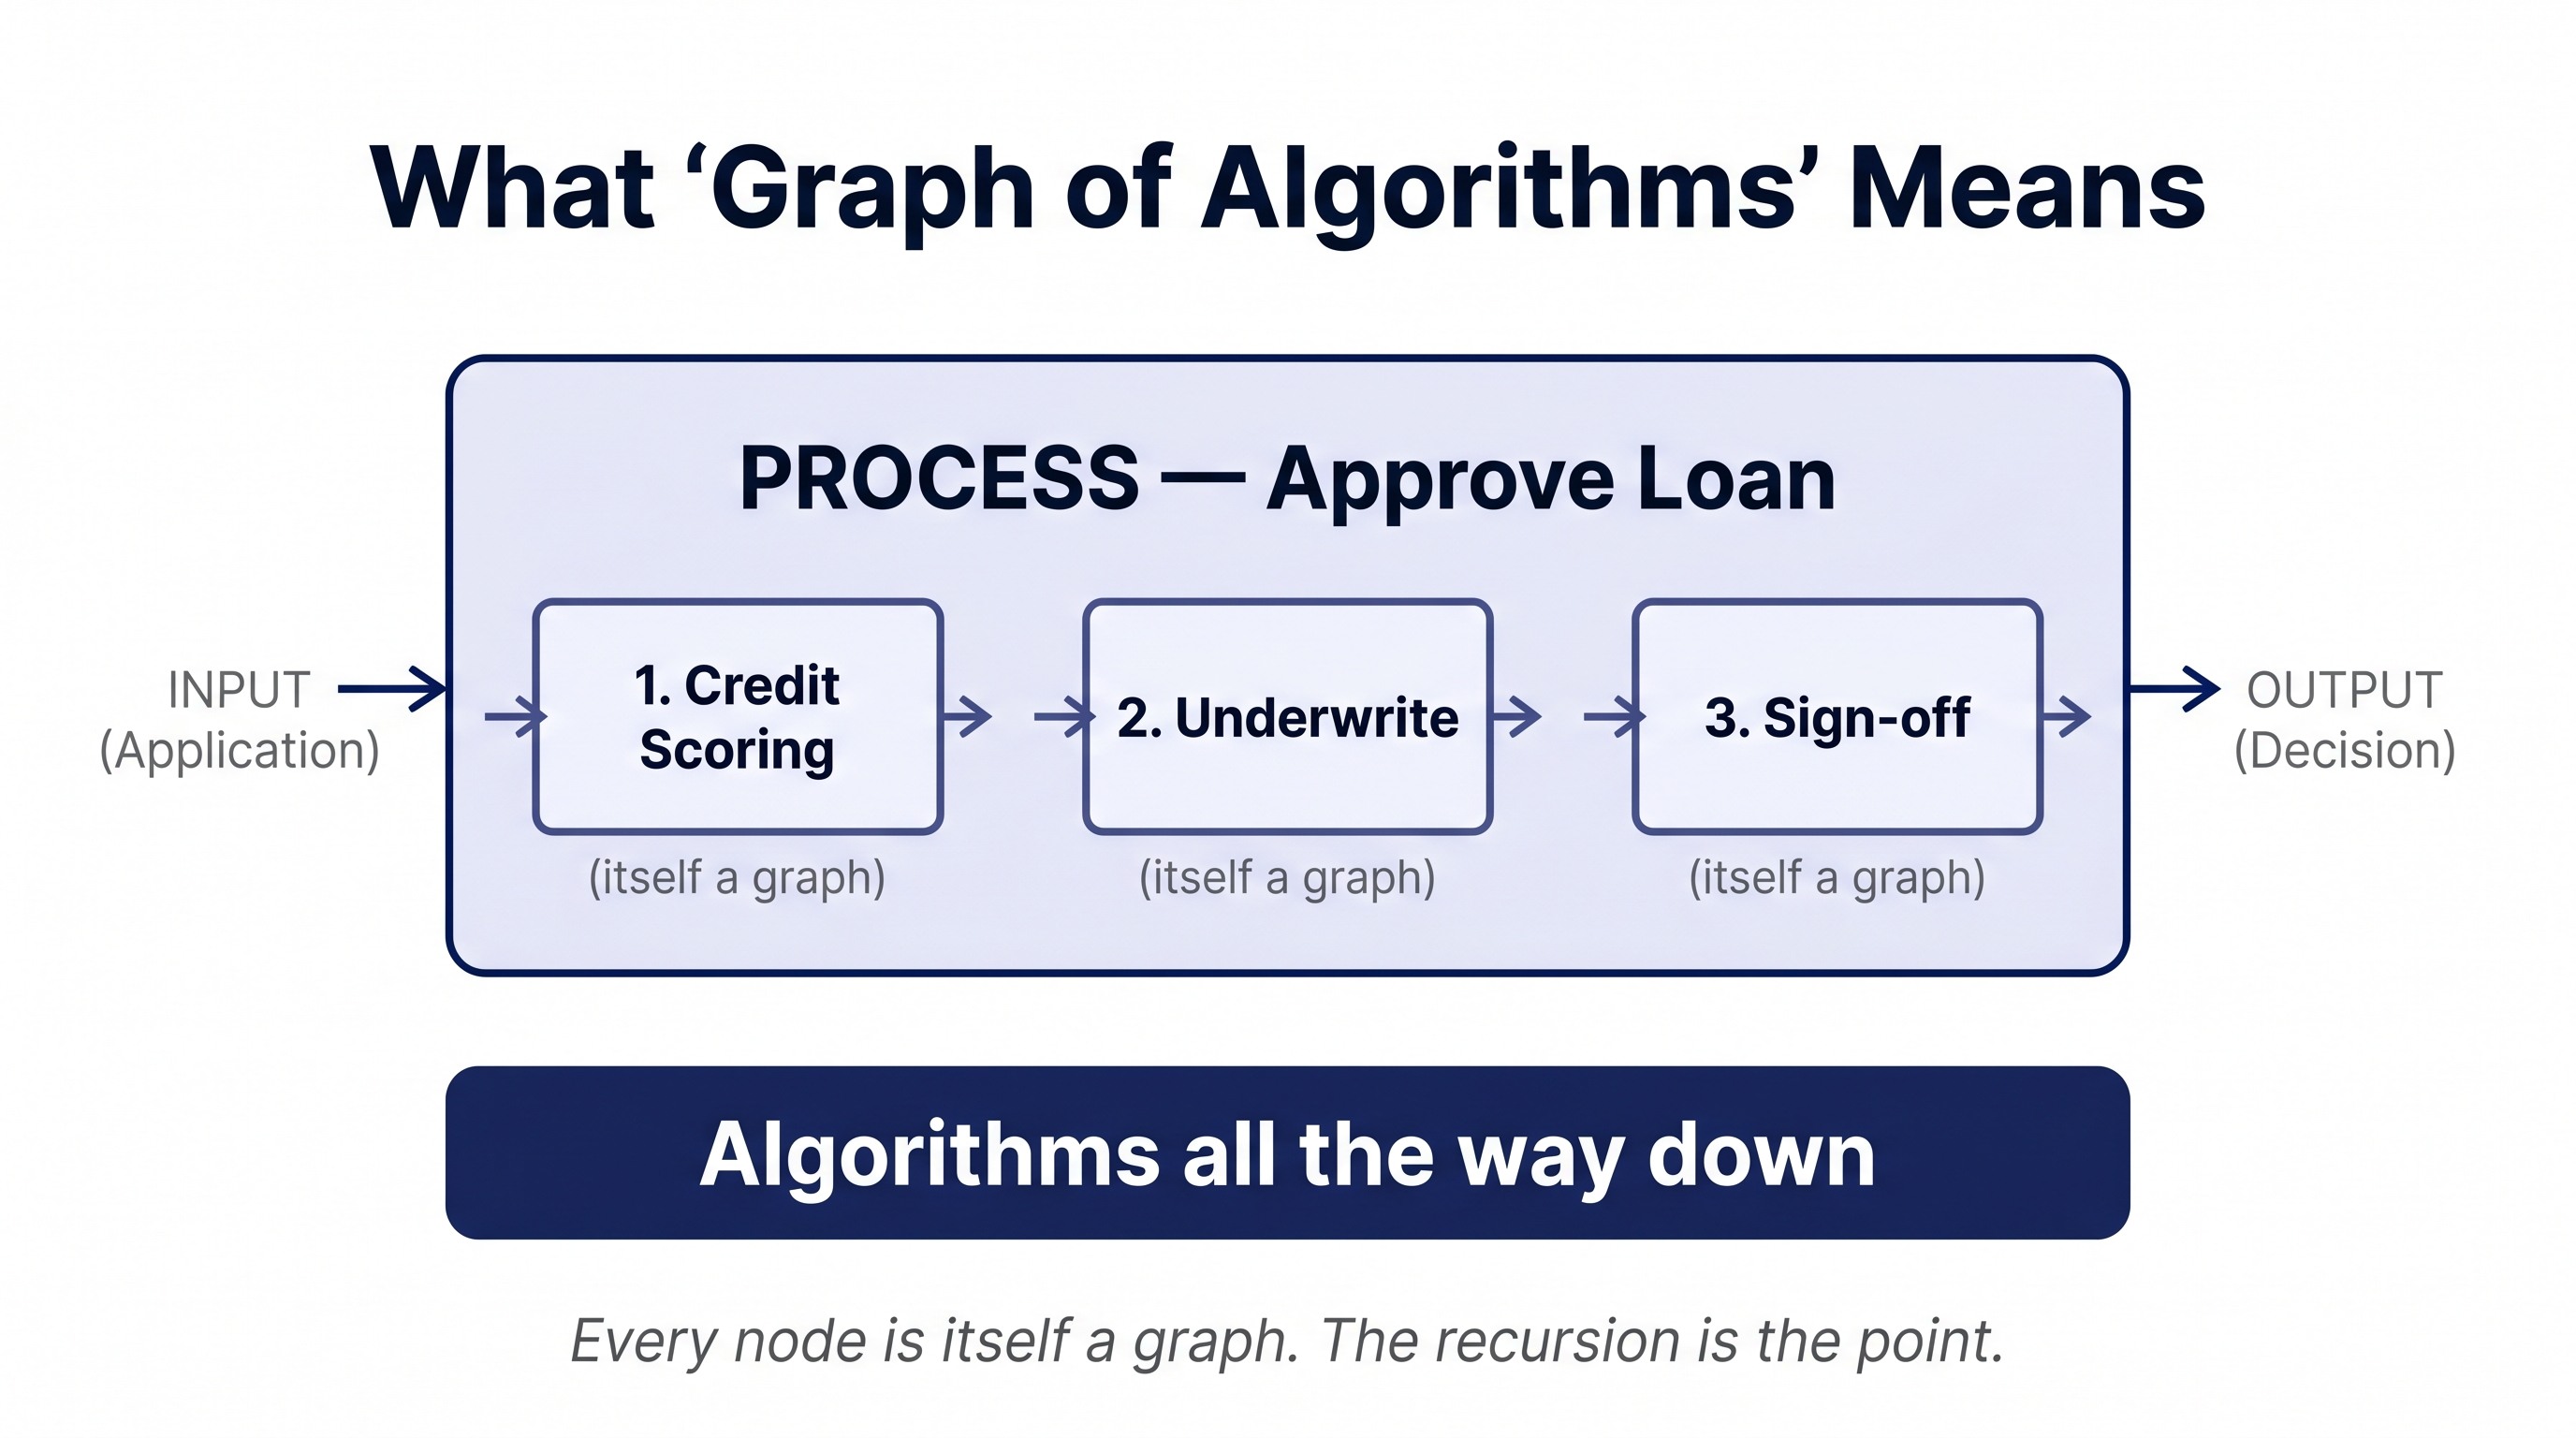
The model is simple. Every business process is an algorithm: it takes input, transforms it, emits output. The input might be a document, a customer record, a decision; the output might be another document, a payment, an approval.
Every node is itself a graph. "Approve loan" contains credit scoring, underwriting checks, exception review, sign-off. "Credit scoring" contains data fetch, feature engineering, model run, override logic. I describe this as algorithms all the way down. The recursion is the point.
Edges between nodes are messages, files, or decisions. An email is an edge. A signed PDF moving from underwriter to risk committee is an edge. A Slack approval is an edge. The graph is the work.
Once you draw a company this way, the next question becomes obvious: which nodes are run by humans, which by software, which by both, and which could be run by an AI agent that did not exist last year.
A Malaysian Loan-Origination Example
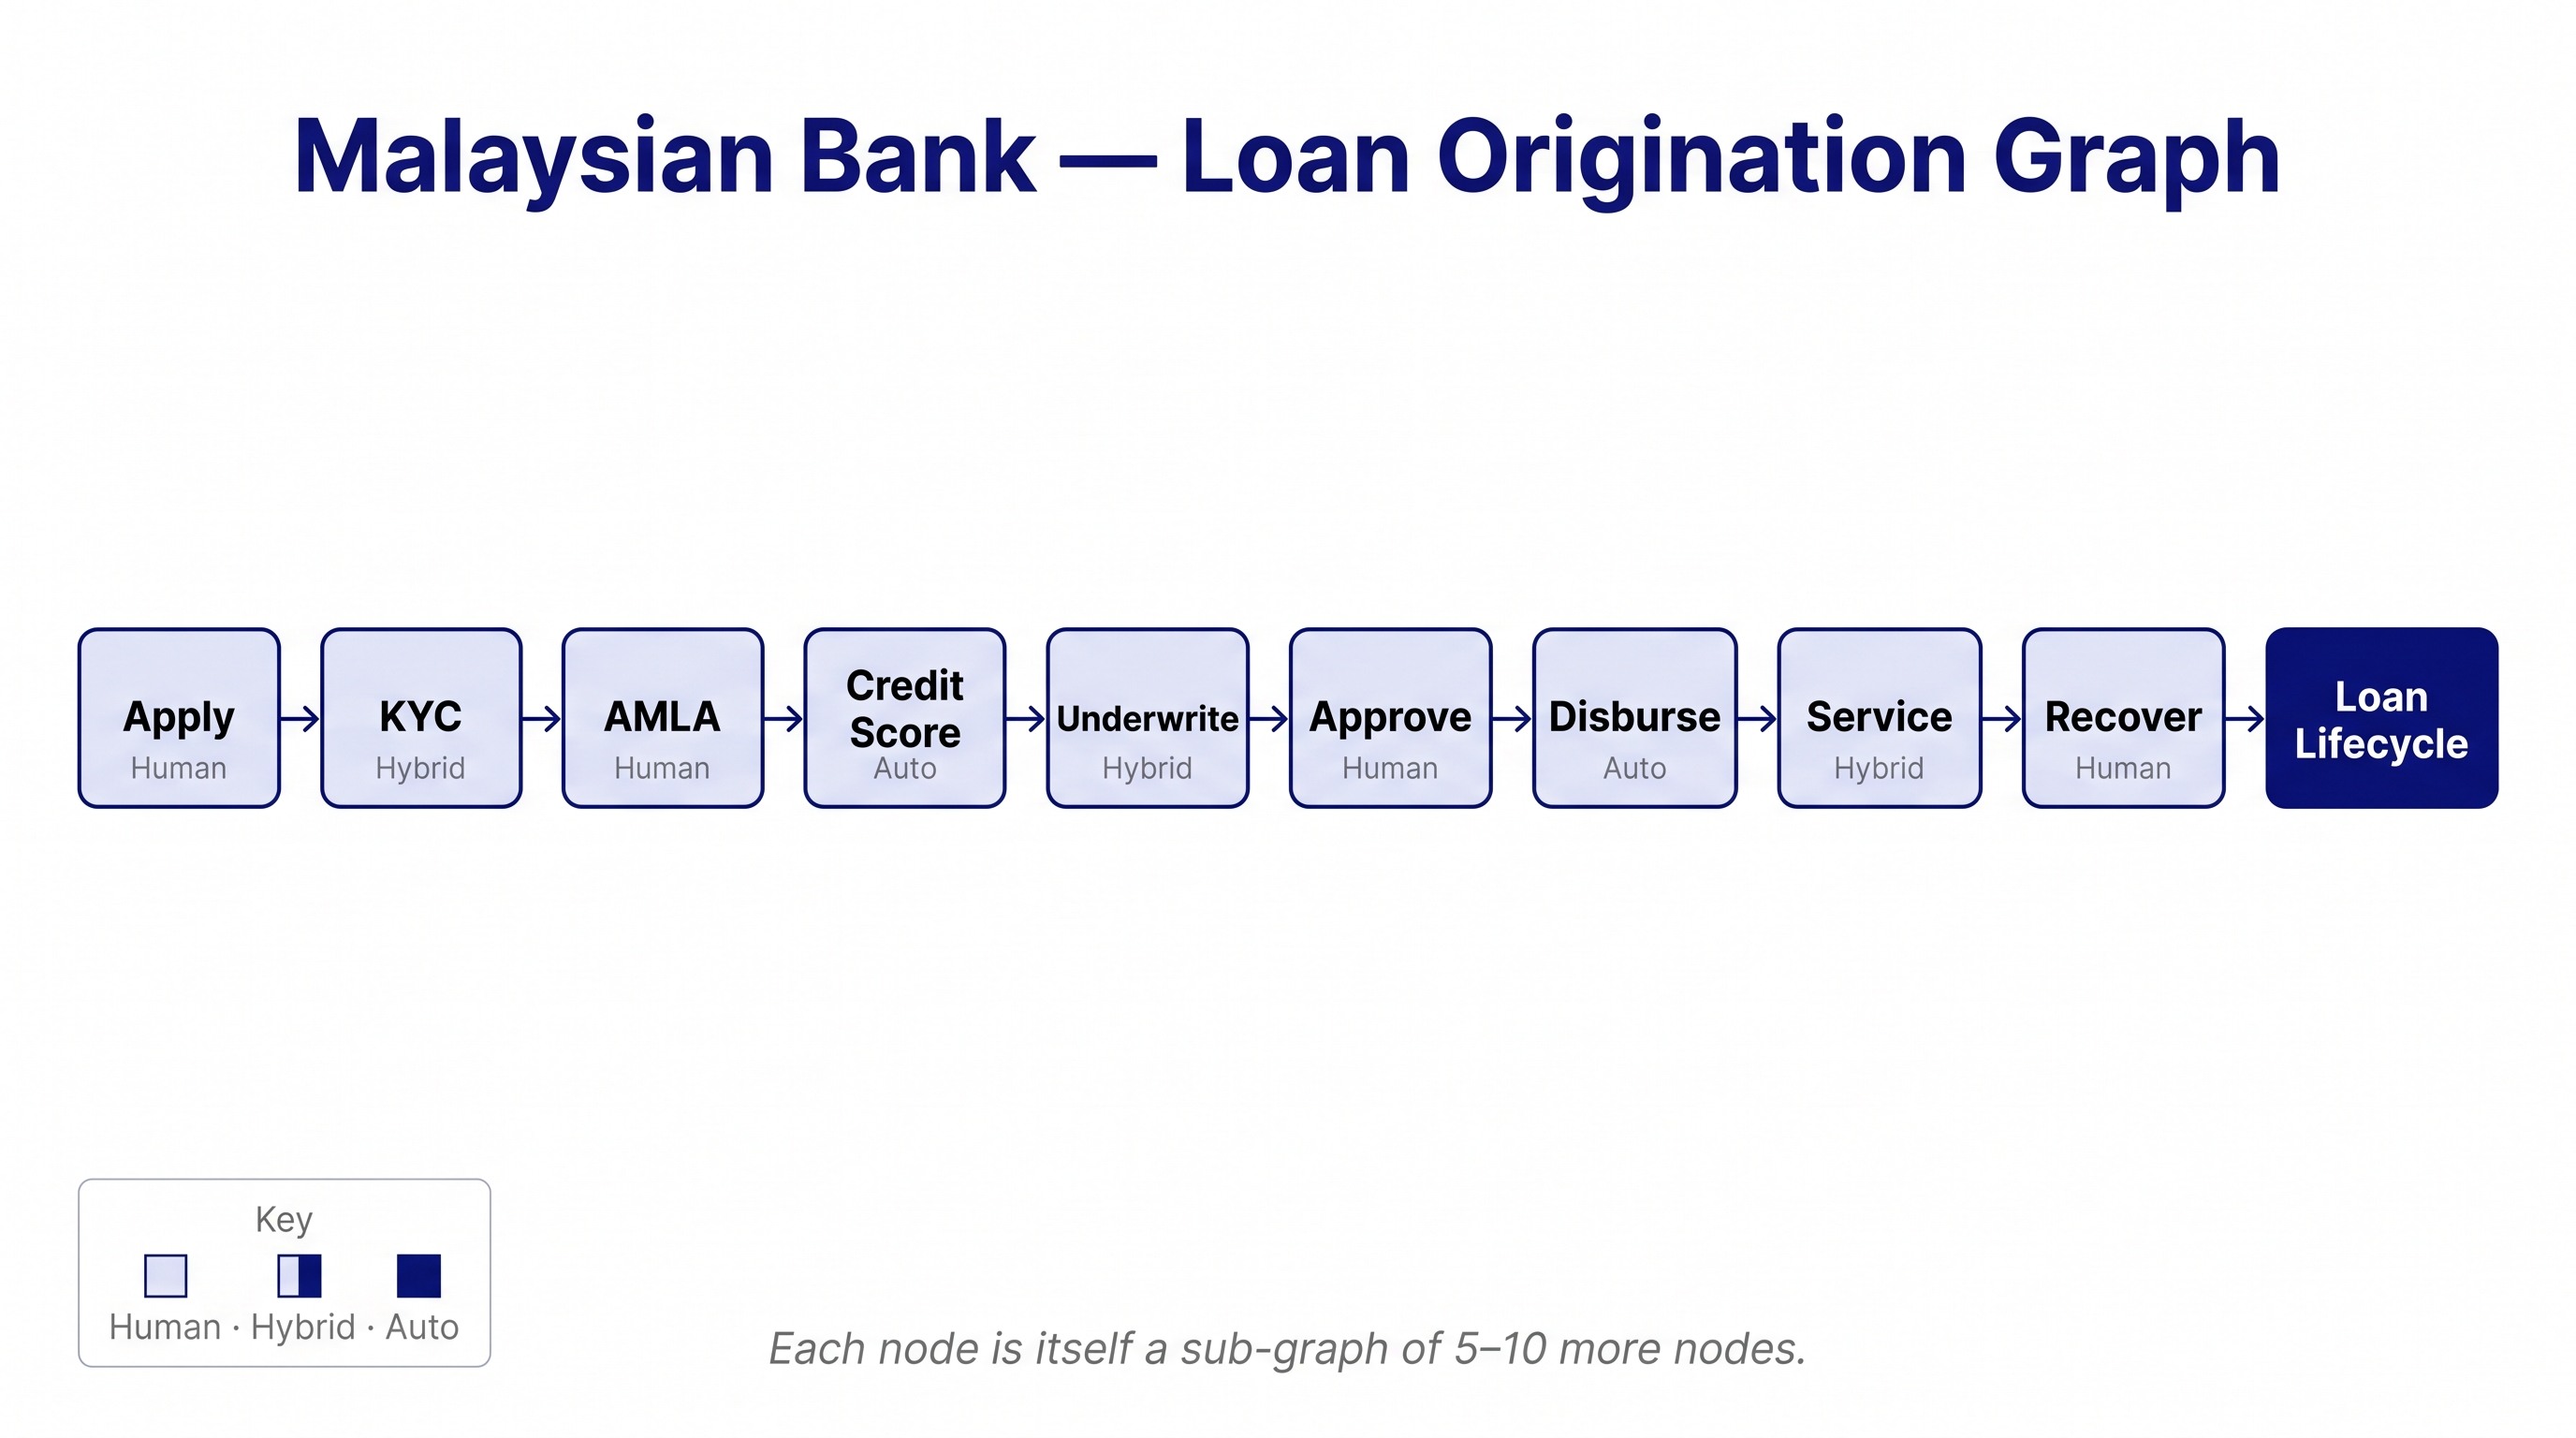
Take a Malaysian bank's personal-loan origination. The customer-facing graph is: apply, verify identity, screen, score credit, underwrite, approve, disburse, service, recover. Nine top-level nodes.
Each one contains more nodes. KYC verification alone contains NRIC validation, photo match, address verification, employer check, AMLA name screening, sanctions list lookup. Six nested nodes inside one top-level node, and that is the simplified version. The real graph has thirty.
Some of those nodes have to be human. AMLA enhanced due diligence on a flagged customer cannot be a model output. An exception decision on an underwriting borderline case is a human role by both internal policy and external regulation.
Some of those nodes are already automated. Credit scoring runs on a model. NRIC validation runs on an API. Sanctions screening runs against a list.
The interesting question is the third category: nodes that could be automated, where AI would do the work faster and more consistently than the human currently doing it, but where no one has drawn the graph carefully enough to see it. In every bank I have looked at, that third category is bigger than the existing automated set.
A Second Example: Month-End Close and Management Reporting
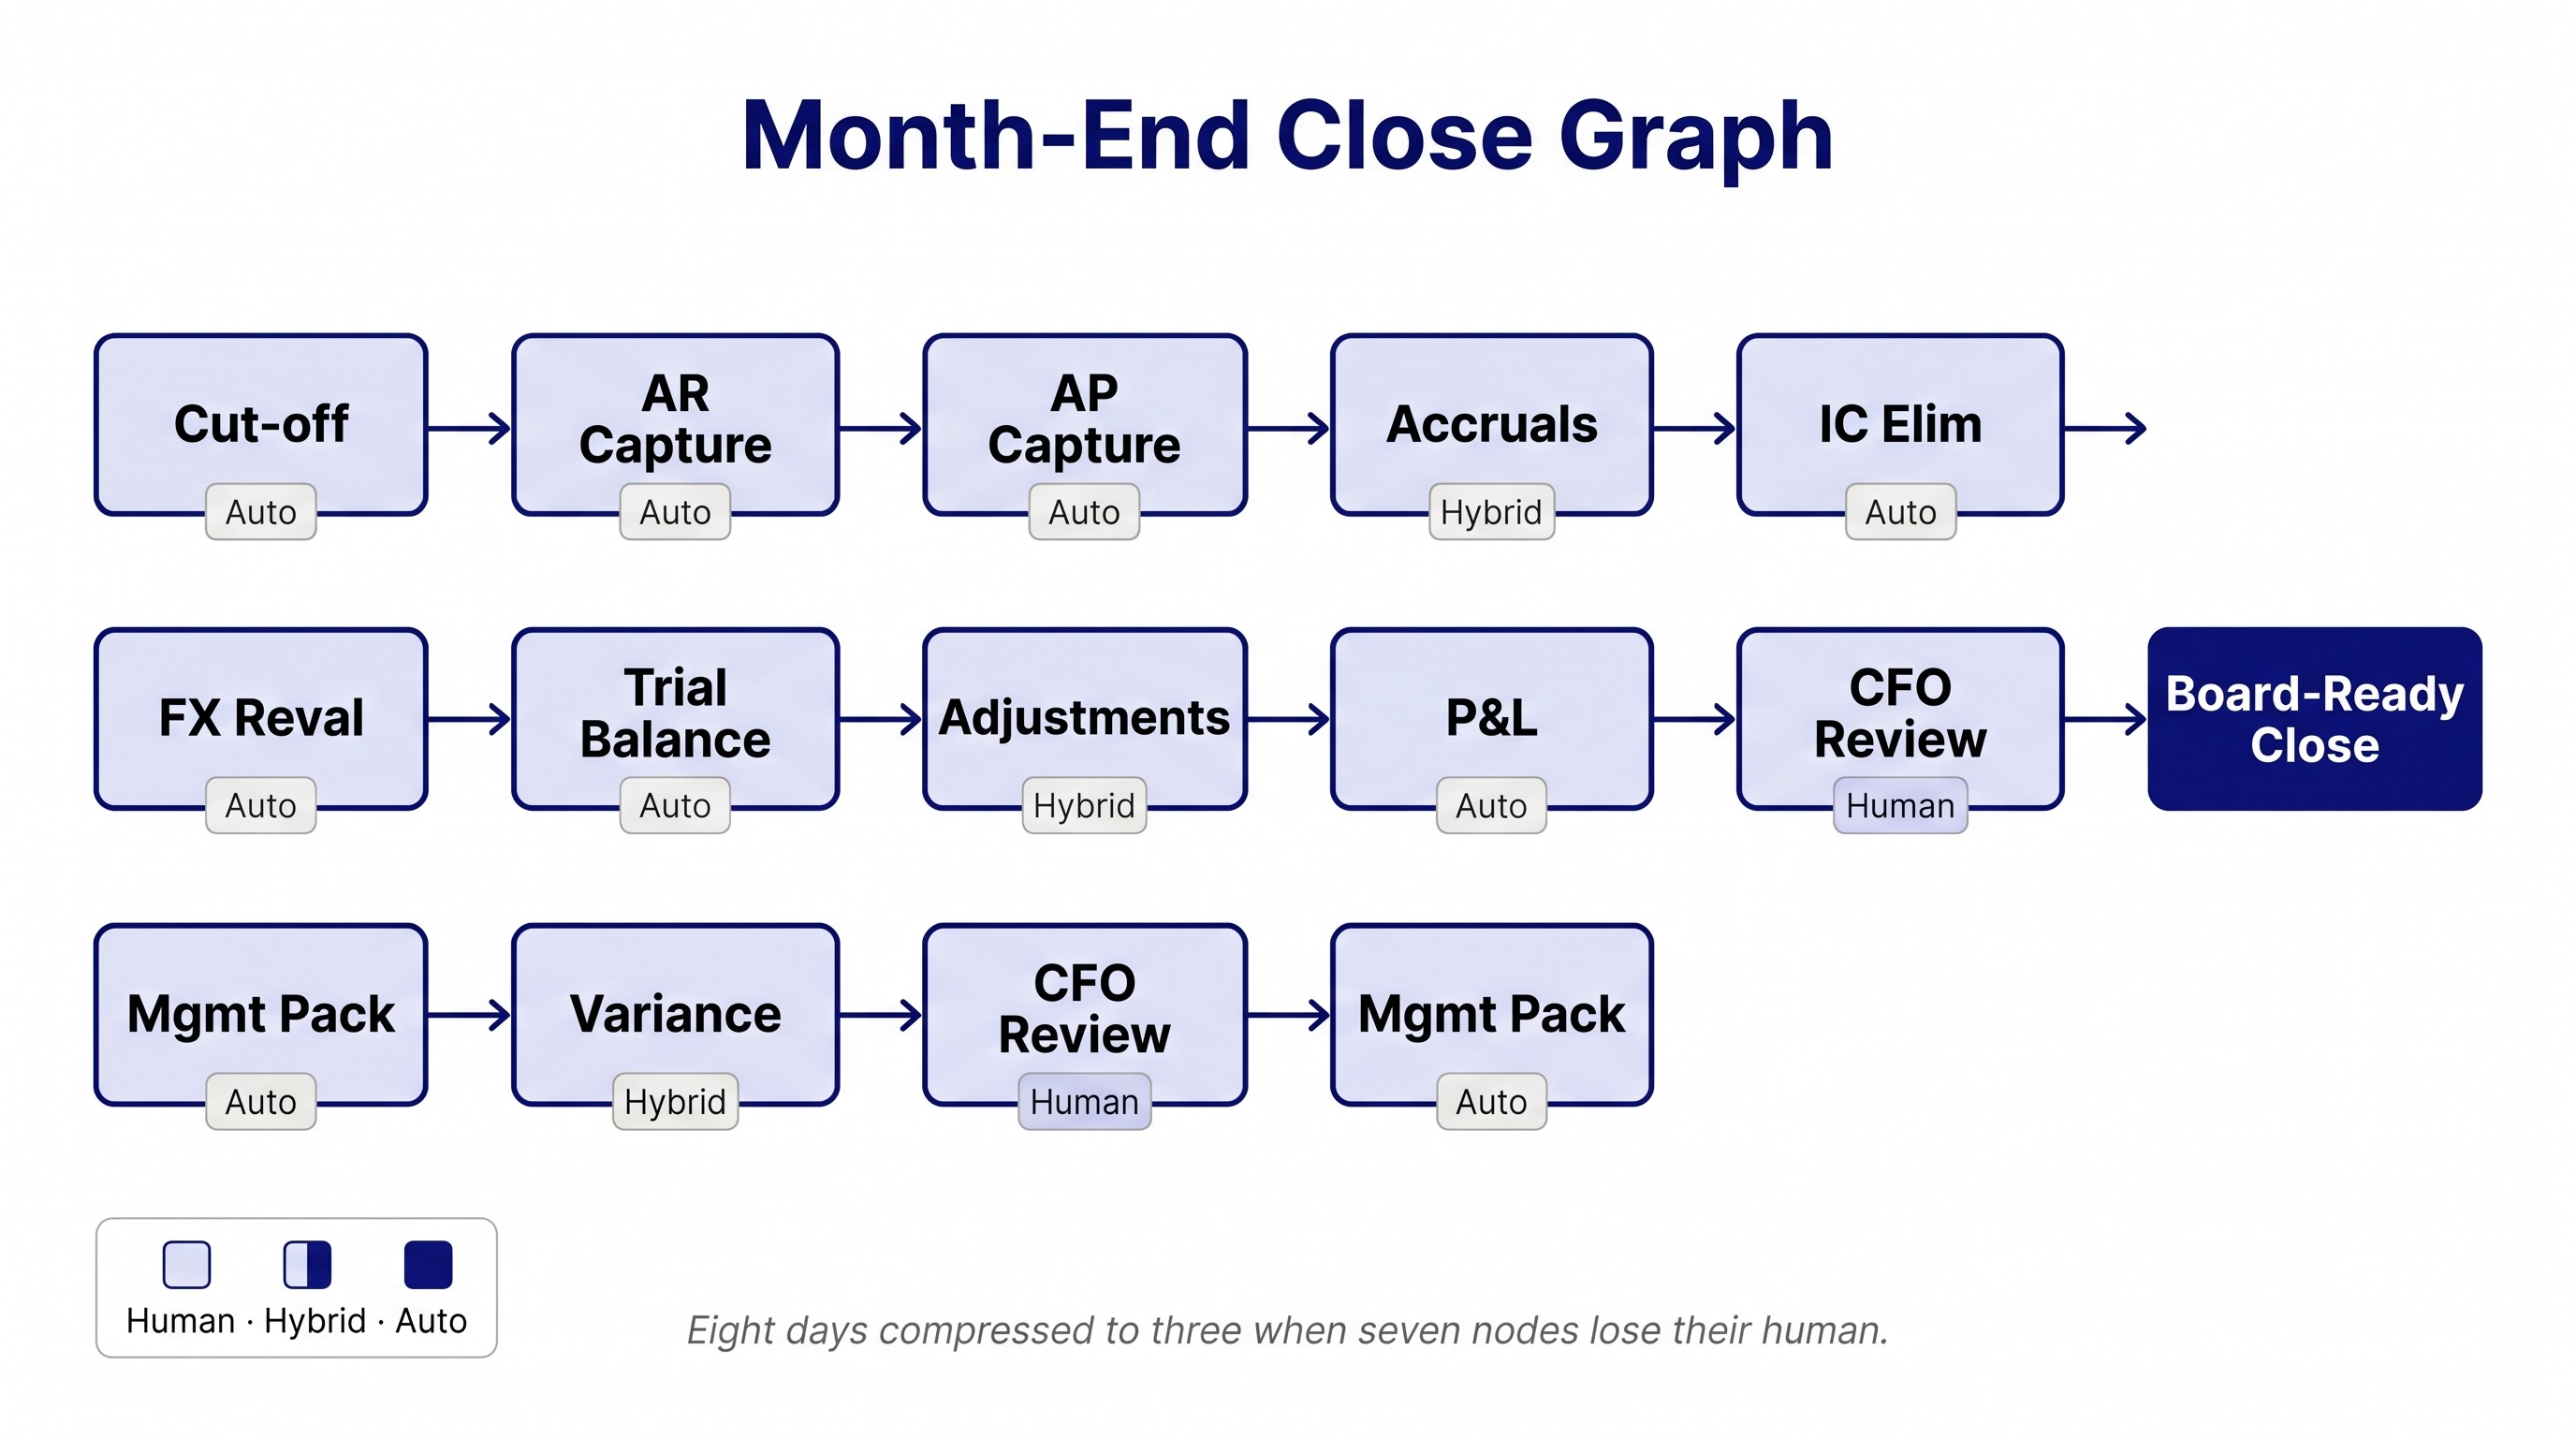
Take any mid-sized company's month-end close. The graph has roughly twelve top-level nodes: cut-off enforcement, AR capture, AP capture, accrual entries, inter-company elimination, FX revaluation, trial balance, adjusting entries, P&L production, balance sheet production, variance analysis against budget, management pack delivery.
Each node contains the same recursion the loan-origination example showed. Variance analysis against budget alone contains data extraction from the GL, mapping to budget categories, flagging variances above threshold, root-cause investigation, driver attribution, narrative drafting. Six sub-nodes, and that is the short version.
Some of those nodes have been automated for two decades. The trial balance is a button in any modern ERP. FX revaluation runs on a rate table and a script. Inter-company elimination has been automated since the late 1990s in consolidation software.
The interesting category, as before, is the third: nodes that look human today but do not need to be. Variance commentary drafting is an obvious one. The senior analyst who writes the management pack narrative is doing pattern-matching across the GL, the budget, the prior-year comparator, and recent operational events. Every step in that pattern-matching can be done by a 2026 LLM with access to the same data. The narrative quality will not be lower. It may be higher because the AI does not get tired by the fourth subsidiary at 9pm on the last day of close.
This is not a hypothetical observation. I have run two engagements in 2026 where the management-accounting close cycle compressed from eight days to three after a graph-of-algorithms review identified seven nodes that did not need a human. Two of the three days that remain are the auditor sign-off node and the CFO review node. Both are regulated-or-policy-fixed, the way AMLA EDD is for a bank.
Management accounting is the cleanest worked example I know of for this model because the inputs are structured (GL, sub-ledgers, budget tables), the outputs are structured (P&L, BS, variance pack), and the regulatory-fixed nodes are well documented (auditor sign-off, statutory filing). Every other category of work in the company is messier than this. If a graph-of-algorithms review pays off on the close cycle, it will pay off on the messier graphs too.
What Changes When AI Can See the Graph
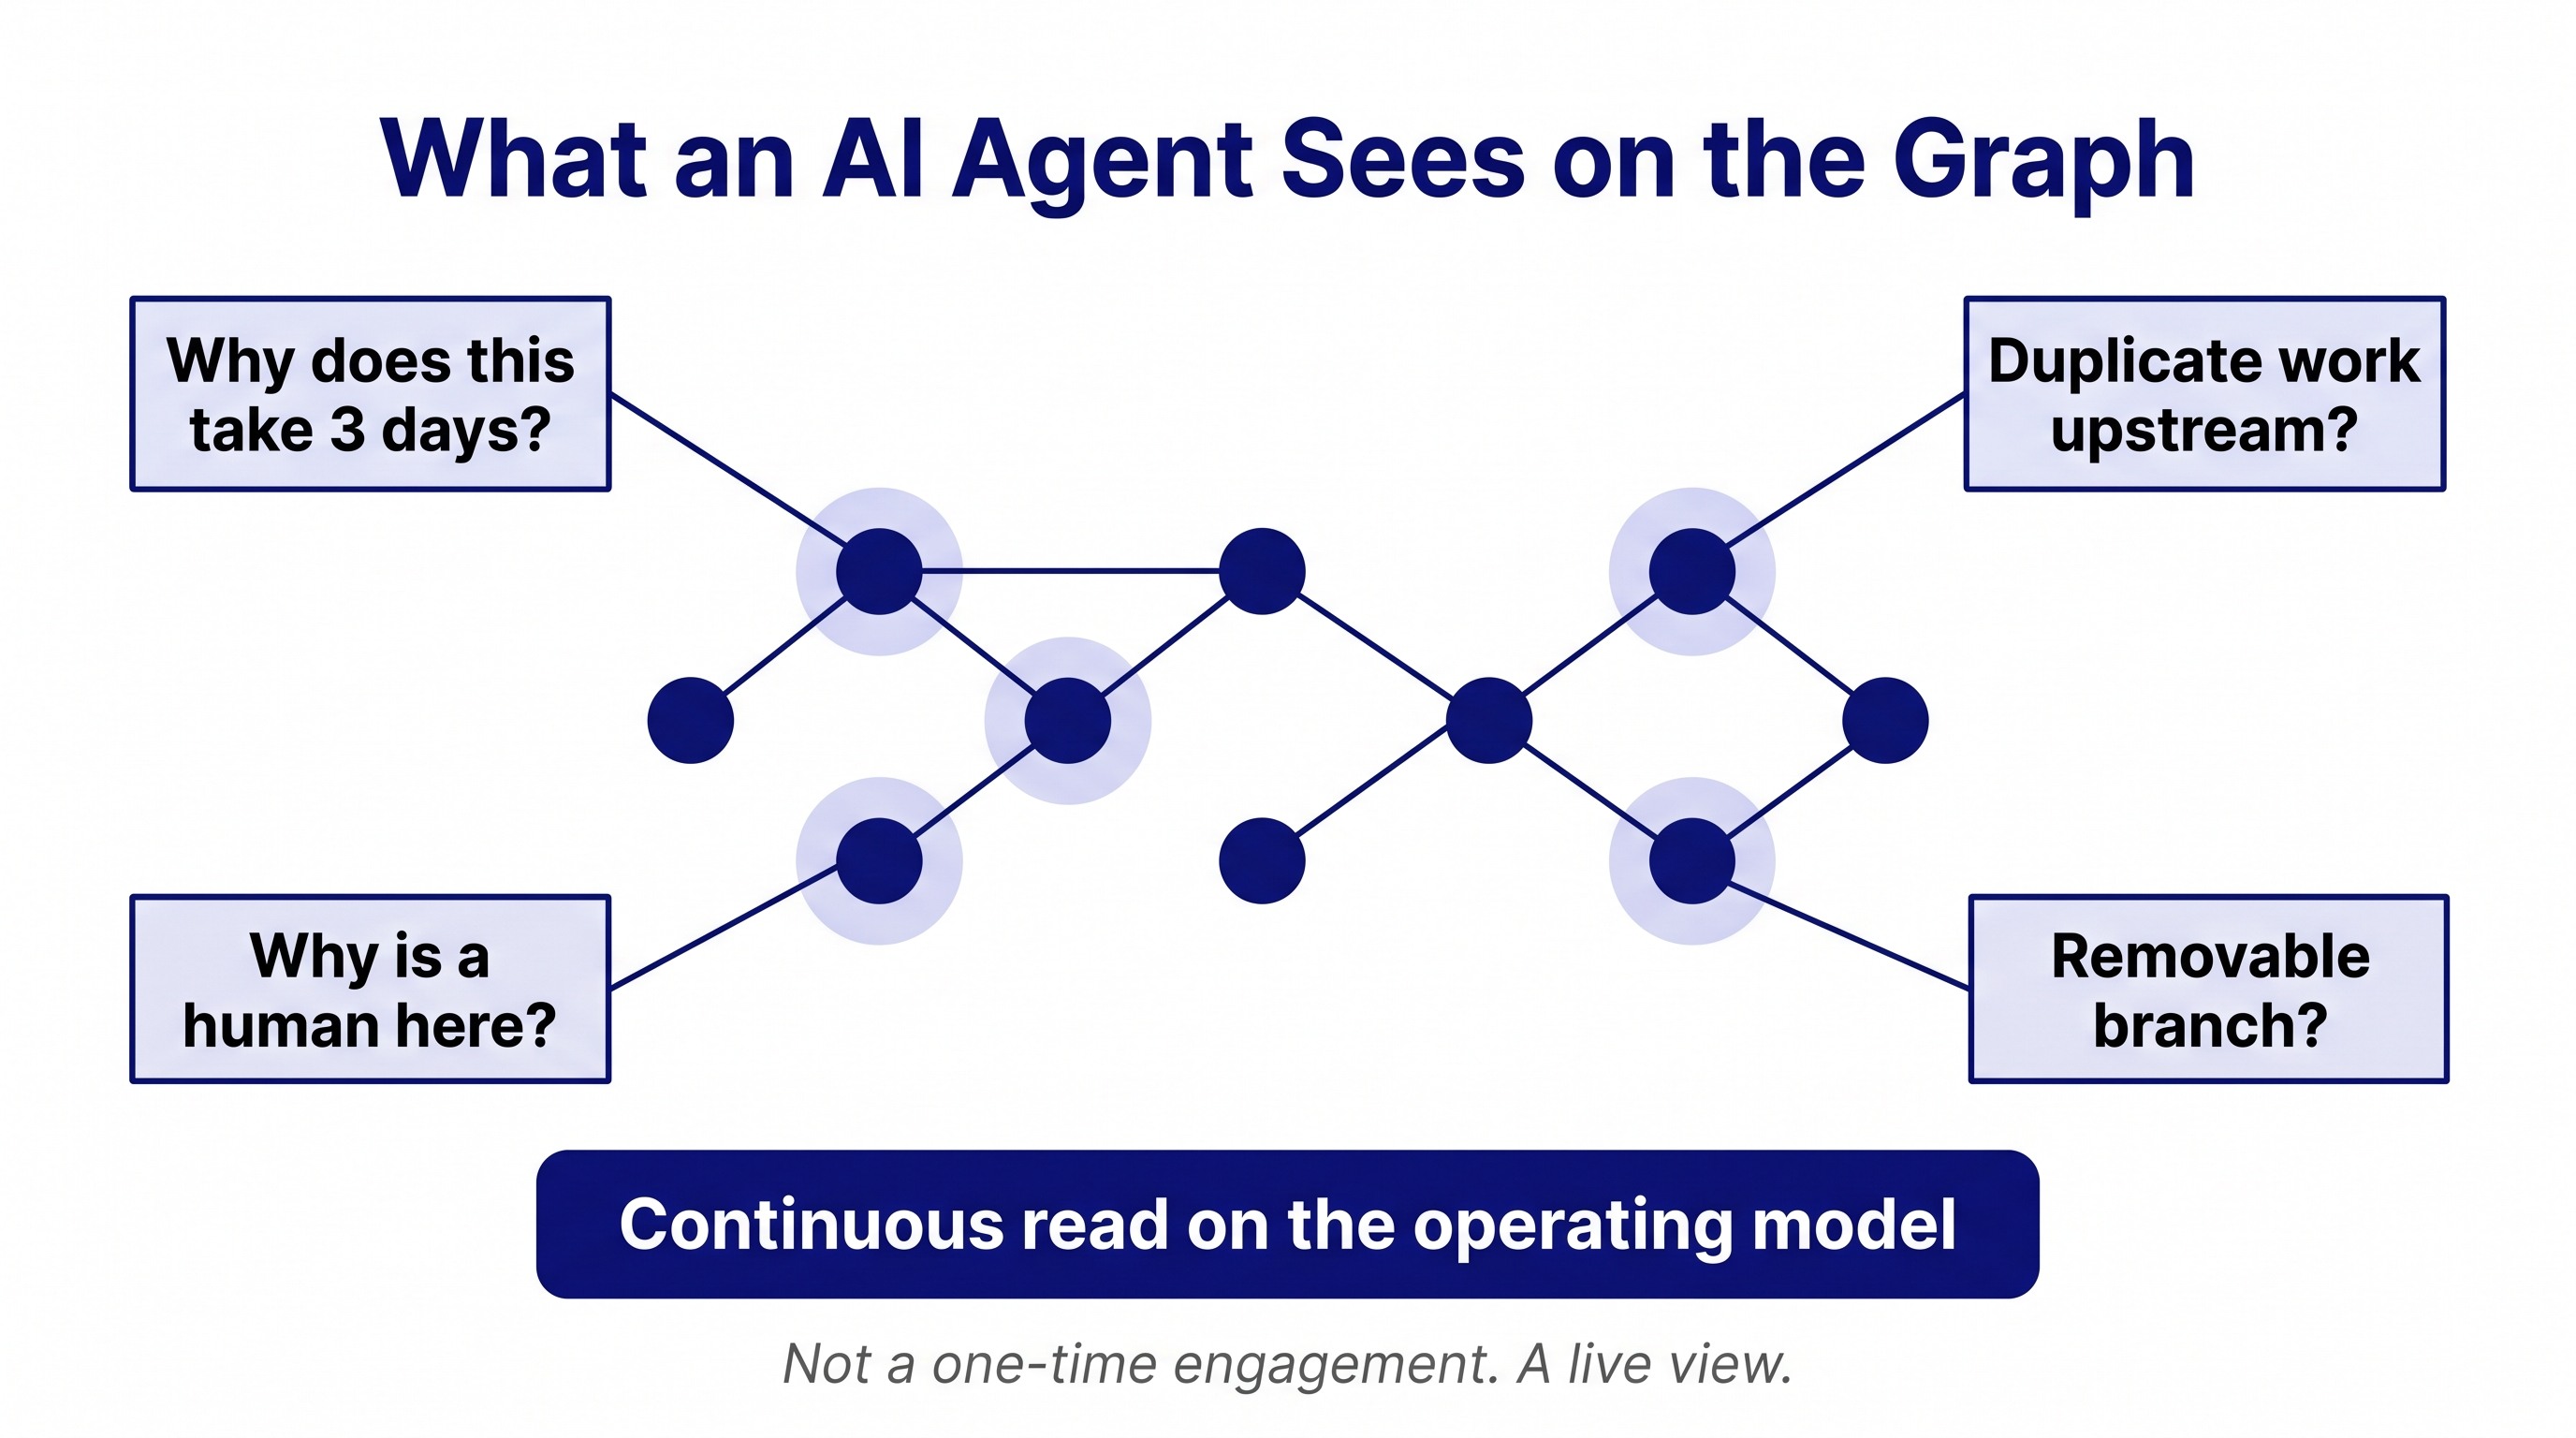
A consulting engagement draws the graph once. The COO sees it for a week, signs it off, the report gets filed, and the graph drifts out of date inside six months.
An AI agent does not work that way. Once the graph is captured in a machine-readable form (and that part is now cheap), the agent can sit on top of it continuously, asking the same questions a good consultant asks but without tiring:
- How many humans handle this node?
- Why does this edge take three days?
- What other nodes do the same work as this one?
- What happens to throughput if we remove this branch?
- Which of these decisions has the lowest reversal rate? Why is a human still making it?
My claim is that this is what the next phase of business optimisation looks like. Not a one-time engagement. A continuous read on the operating model, identifying nodes for redesign every week.
The honest consequence is that easy-to-automate human jobs become machine work. I will not hide that. The efficiency story and the displacement story are the same story. Both readings are true.
The caveat I see operators get wrong most often: in regulated industries, AI cannot delete nodes that regulation requires. AMLA EDD has to be done by a human until Bank Negara says otherwise. The valuation report has to be signed by a registered valuer until the Board of Valuers changes its rules. AI can make those nodes faster and better-evidenced, but it cannot remove them. A graph-of-algorithms view of a bank still has nodes that look identical in 2026 and in 2030 because the law says so.
That is not a problem with the model. It is a refinement: the optimiser has to know which nodes are legally fixed, which are operationally fixed, and which are merely habit. Only the third category is fully open to it.
The Harness Queue Is the New Bug Queue
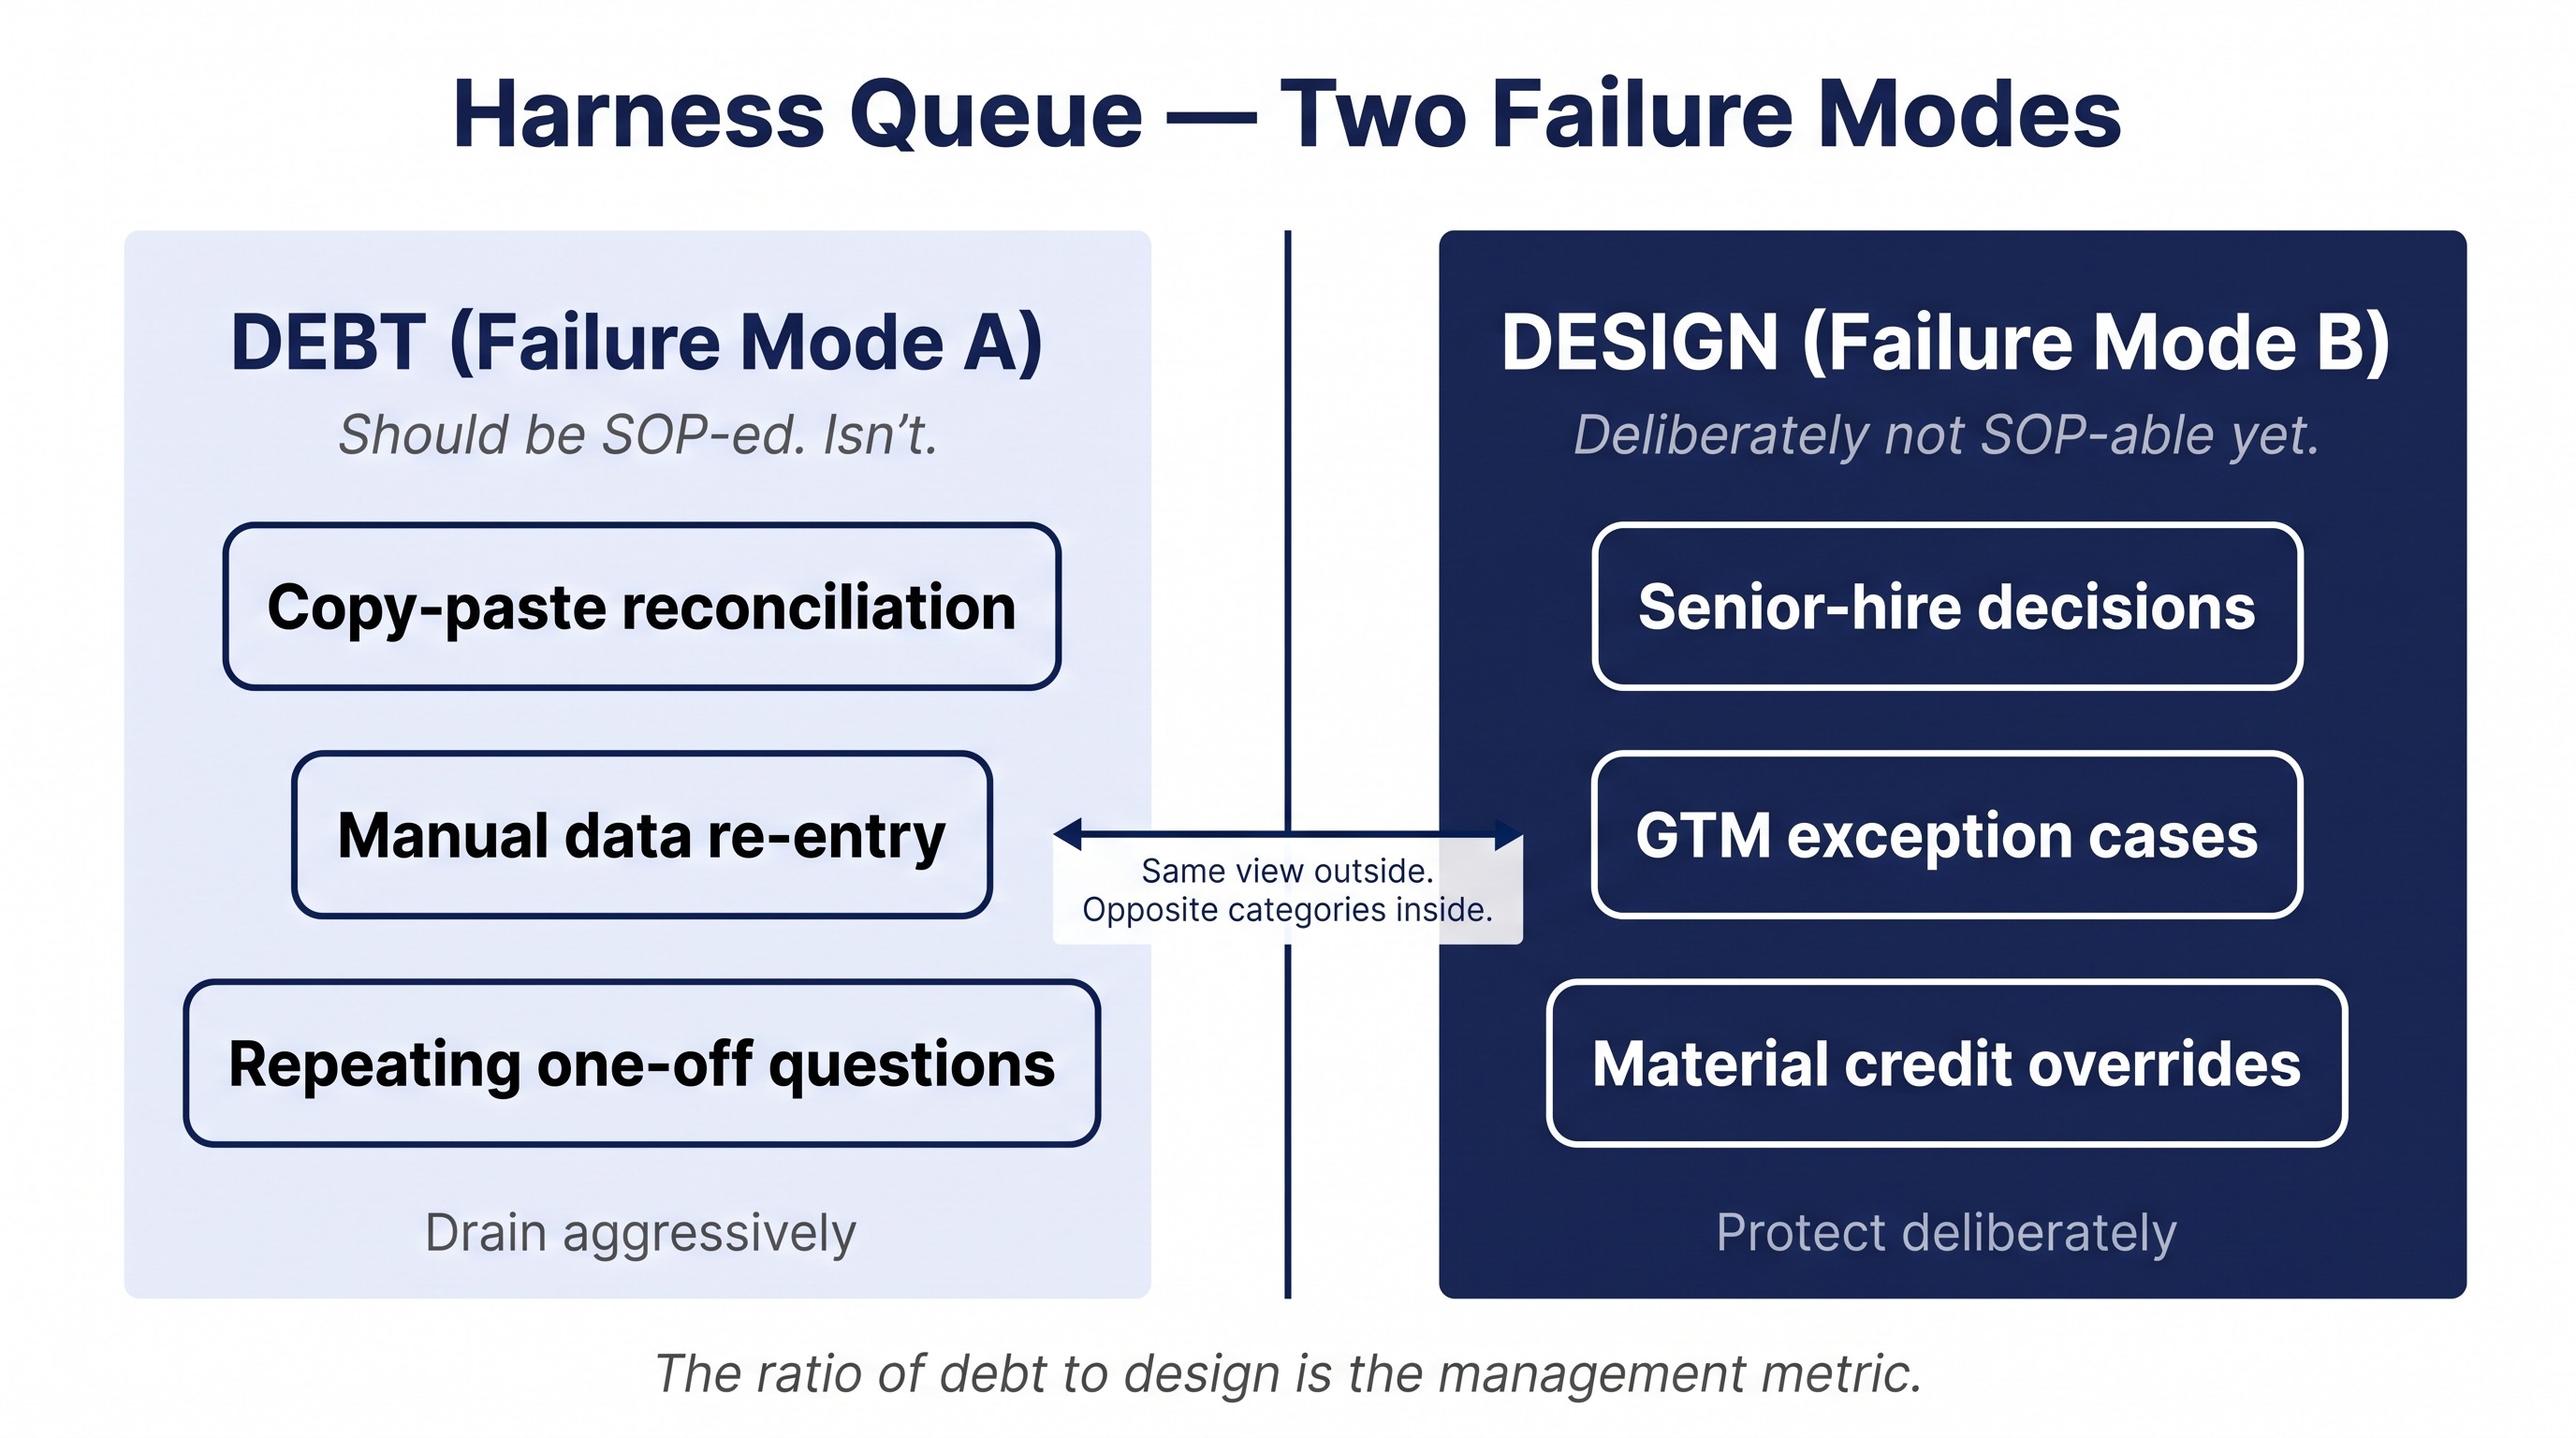
Most operators trying to apply this model run into the same diagnostic problem within a week. They draw the graph, annotate the nodes, identify the human nodes, and then get stuck distinguishing two failure modes that look identical from the outside.
Failure mode (a): debt. The work could be done by an automated workflow. Nobody wrote the workflow. So a human sits inside a software harness, doing it one record at a time, often using copy-paste and email. The work was always SOP-able. The team simply never built the SOP.
Failure mode (b): design. The work could be SOP-ed, but the cost of a wrong SOP is greater than the cost of slow human judgement. New-product GTM decisions. Senior-hire selection. Material credit exception cases. Cross-border tax structuring decisions. A human sits in the harness because the work is deliberately exception-class: low frequency, high consequence, thin data. The SOP would be wrong more often than the human is.
From the outside, both look the same: a human at a computer, processing one item at a time. From the management view, they are opposite categories. Drain failure mode (a) aggressively. Protect failure mode (b) deliberately.
The management metric that comes out of this is the ratio: of all the harness-mediated human work happening this week, what percentage was (a) and what percentage was (b)? The first number is your debt. The second number is your design. The team's job is to shrink the first without misclassifying the second.
I call the (a) bucket the harness queue, and I treat it the way an engineering team treats a bug queue. Ticket every instance. Triage by frequency multiplied by time-saved. Build the workflow that closes the ticket. The (b) bucket is the design choice and gets reviewed quarterly, not weekly.
SOPs Become Code
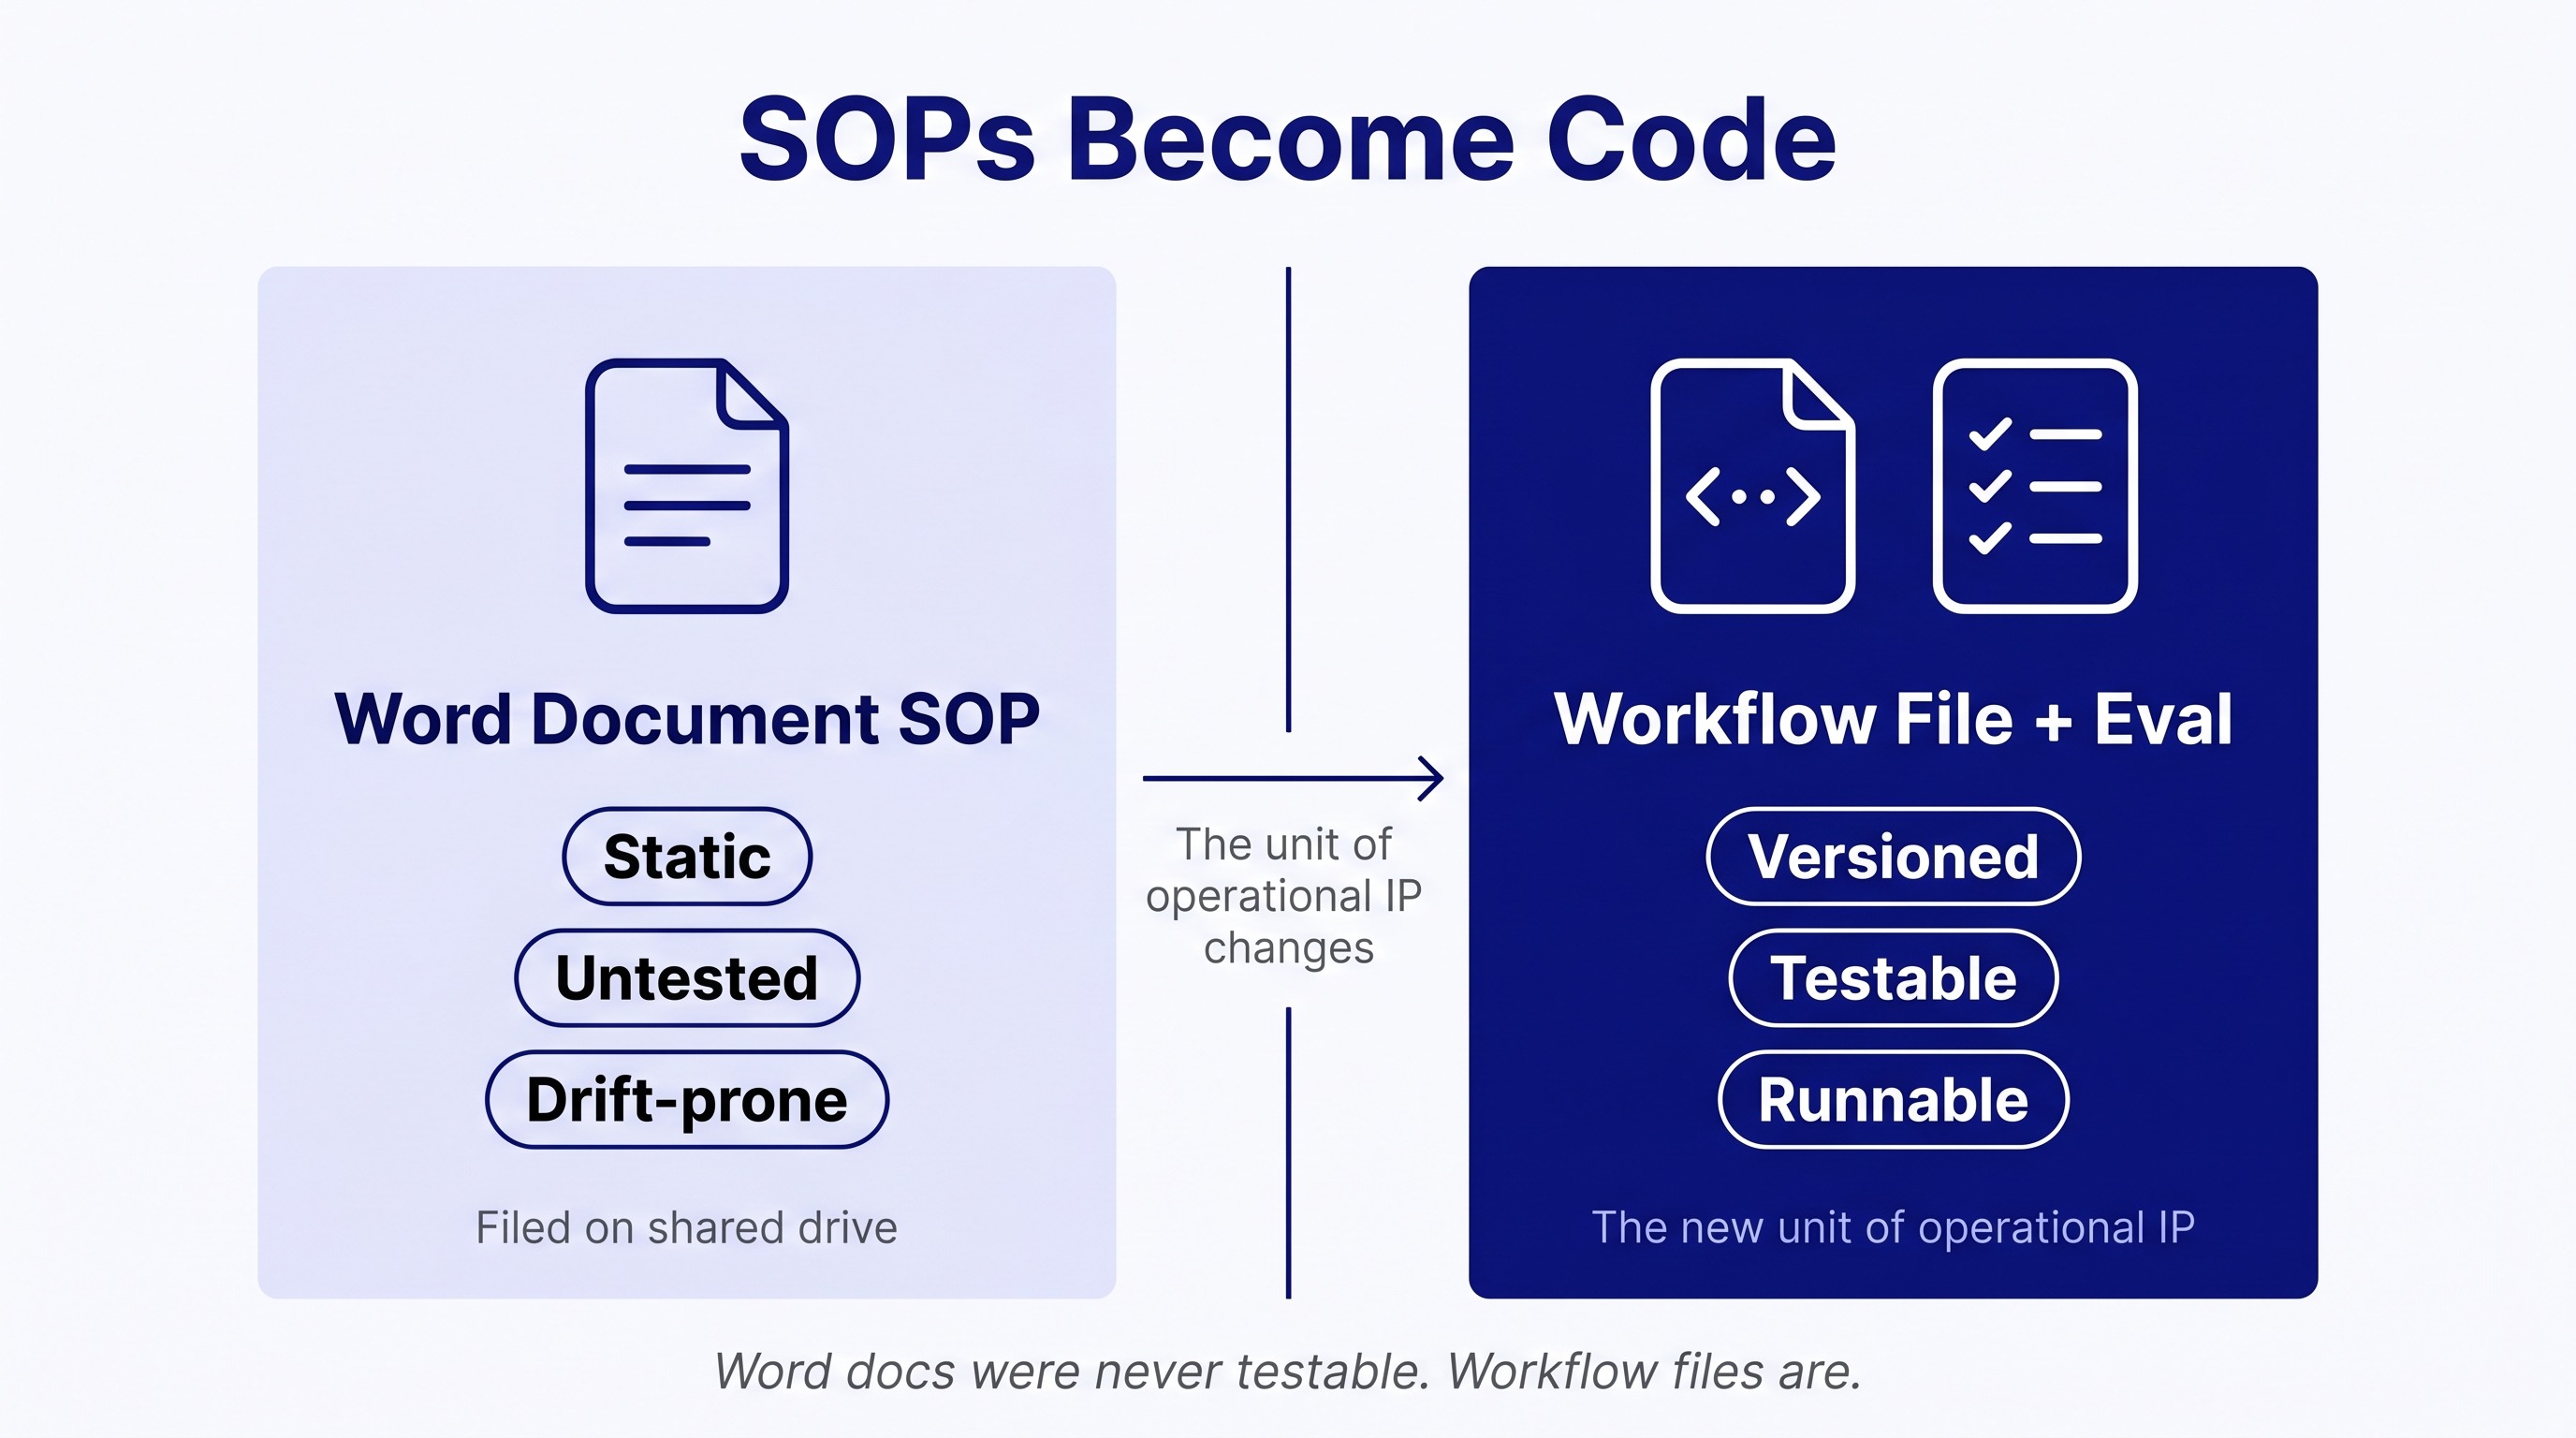
The reason the graph of algorithms only started working in 2026 has nothing to do with the model and everything to do with the SOP layer underneath it.
For thirty years the SOP was a Word document. Someone wrote it. It was approved. It was filed on the shared drive. The actual work diverged from it within weeks. The SOP was not testable. The SOP was not versioned. The SOP was not enforceable. The SOP existed for audit and onboarding, not for execution.
This is the part of the operating model that has changed in the last year. The SOP is now a workflow file. The workflow file is versioned. The workflow file is testable. The workflow file has an eval attached to it that asserts what good output looks like, and the eval runs every time the workflow runs.
The implication is sharper than most operators have priced in. The unit of operational IP in a company is no longer "the team that knows how to do X." It is now "the workflow file that does X, plus the eval that says the workflow is doing X correctly." The team that knows how to do X is the team that wrote the workflow file and the eval. The workflow file is the asset. The team is the maintainer.
This is the inversion that makes the graph of algorithms tractable. The graph by itself is just a map. Without testable SOPs at every node, the map cannot be executed. With testable SOPs at every node, the map becomes the operating manual, the audit trail, and the deployment artifact at the same time.
SOPs were always supposed to be testable. They never were because they were Word documents. The moment they become code, they become every other lever this article has been describing.
Roles Become Skills
When the work at every node is either an SOP-as-workflow or a harness-mediated exception case, the unit of human contribution changes. It stops being "I am the senior PM" or "I am the head of marketing" or "I am the management accountant." It starts being "I have the skills to design workflows, optimise existing ones, and generate net-new structures that did not exist before."
PM is a skill. Design is a skill. Pitch is a skill. Costing is a skill. Variance commentary is a skill. The org chart was the artifact that pretended roles existed independently of the skills underneath them. As soon as the SOP-as-workflow becomes the unit of operational IP, the org chart stops being a useful description of how value is created.
This shift has implications for hiring, compensation, and headcount that I do not think most operators have priced in yet. The team that runs a graph of fifty workflows does not look like the team that ran fifty roles. It is smaller, more senior, and paid for skill composition rather than role tenure.
Three Moves for This Week
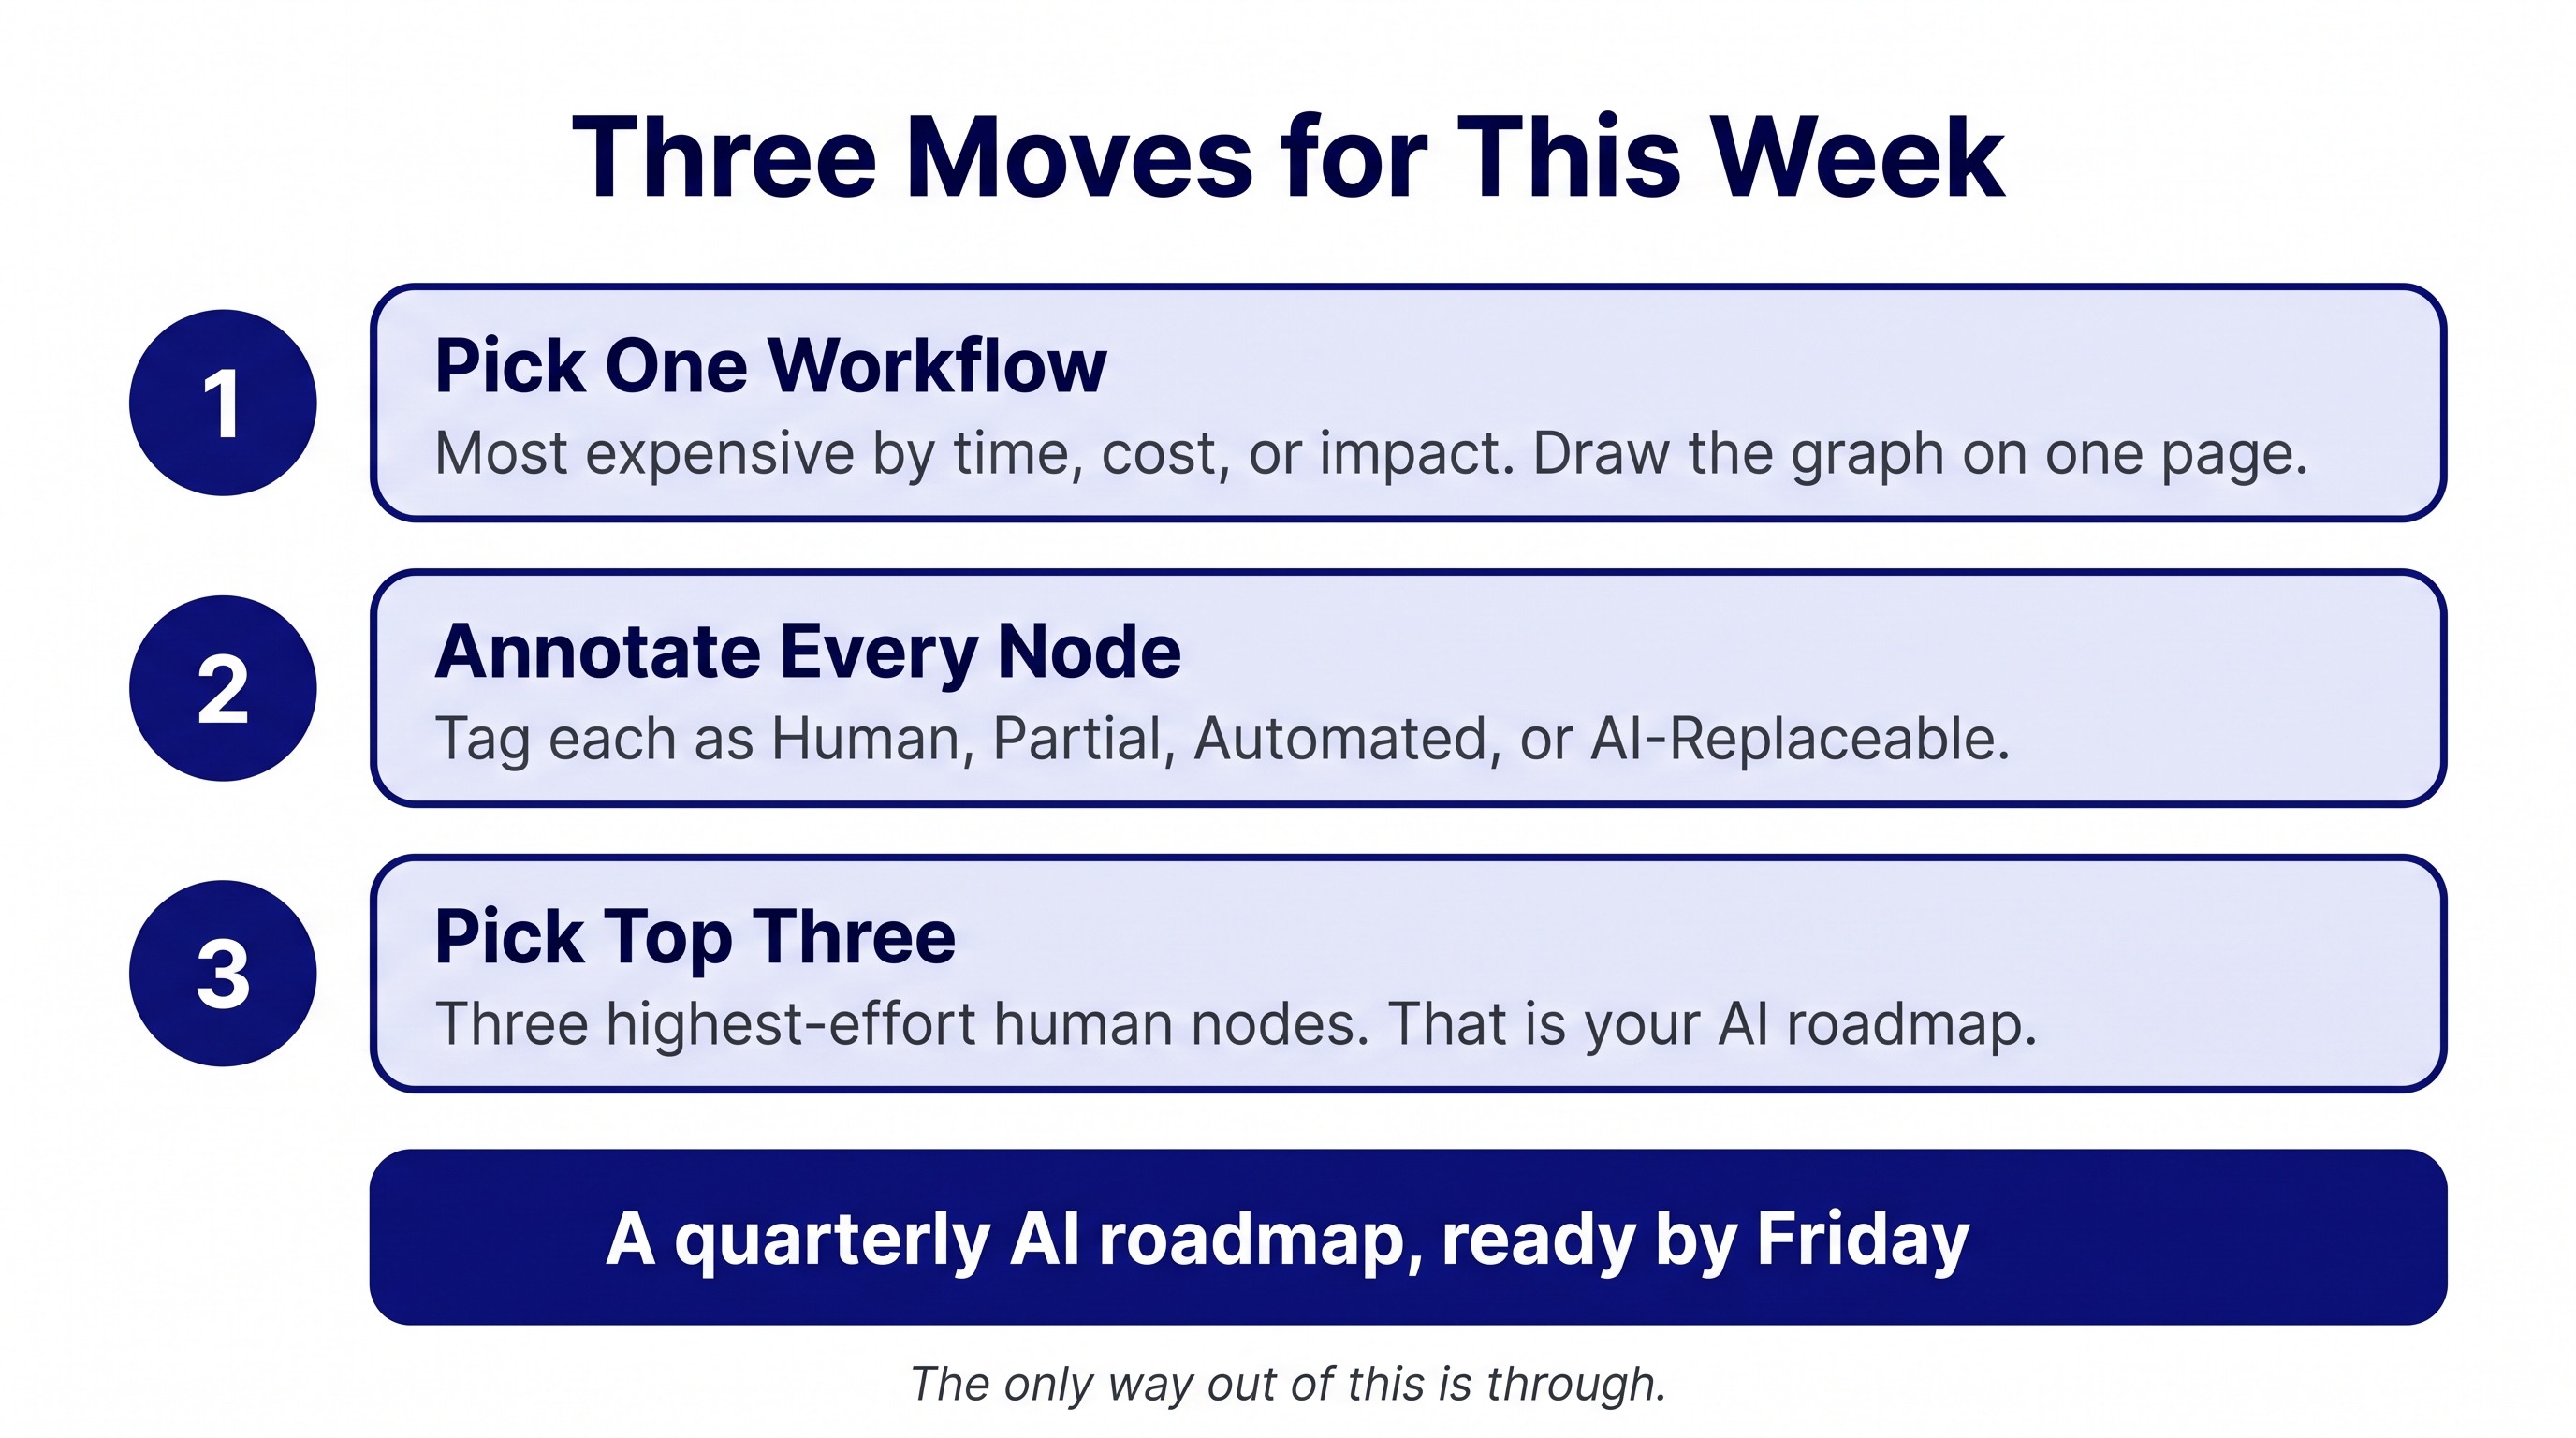
If you read this piece and want to act on it without hiring a consultant, three moves are enough to start.
Move 1: Pick your most expensive workflow and draw its graph on one page. Most expensive can mean most time, most cost, or most customer impact. One workflow, one page. Nodes are processes. Edges are the artifacts that pass between them. Do not try to draw the whole company.
Move 2: Annotate every node. Four labels: human, partial automation, fully automated, AI-replaceable. The last category is the new one. It captures nodes that could be run by a 2026-class AI agent that did not exist when the workflow was first designed. You will be surprised how many nodes belong in that fourth category once you actually look.
Move 3: Pick the three highest-effort human nodes and treat them as your AI roadmap. Not all three at once. One at a time, in order of effort saved. Each one is a small, scoped project: design the AI replacement, run it in parallel with the human for two weeks, switch over when the quality matches.
That is a quarterly roadmap. It is also a defence against the version of this that gets done to you instead of by you. The only way out of this is through.
The competitor in your sector will draw their graph this year. If you do not draw yours, you will eventually be reading theirs in a McKinsey deck, and they will know it before you do.
Part of the Business Process Intelligence series from KG Consultancy.
Strategy and technology are the same decision. Over 15 years in fintech (CTOS, D&B), prop-tech (PropertyGuru DataSense), and digital startups, I have built frameworks that help founders and executives make both moves at once. Based in Kuala Lumpur.
Working on a 0→1 product?
I help founders and operators go from idea to validated product. Let's talk about yours.
Get in touch →